expyfun.analyze.barplot
- expyfun.analyze.barplot(h, axis=-1, ylim=None, err_bars=None, lines=False, groups=None, eq_group_widths=False, gap_size=0.2, brackets=None, bracket_text=None, bracket_inline=False, bracket_group_lines=False, bar_names=None, group_names=None, bar_kwargs=None, err_kwargs=None, line_kwargs=None, bracket_kwargs=None, pval_kwargs=None, figure_kwargs=None, smart_defaults=True, fname=None, ax=None)[source]
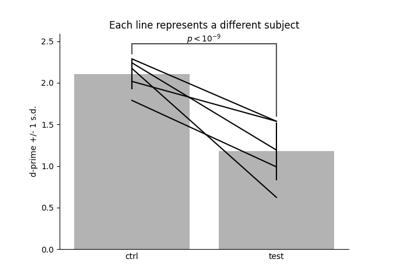
Makes barplots w/ optional line overlays, grouping, & signif. brackets.
- Parameters:
- harray-like
If h is 2-dimensional, heights will be calculated as means along the axis given by axis. If h is of lower dimension, it is treated as raw height values. If h is a
pandas.DataFrameand bar_names isNone, bar_names will be inferred from the DataFrame’s column labels (ifaxis=0) or index labels.- axisint
The axis along which to calculate mean values to determine bar heights. Ignored if h is 0- or 1-dimensional.
- ylimtuple | None
y-axis limits passed to matplotlib.pyplot.subplot.set_ylim.
- err_barsstr | array-like | None
Type of error bars to be added to the barplot. Possible values are
'sd'for sample standard deviation,'se'for standard error of the mean, or'ci'for 95% confidence interval. IfNone, no error bars will be plotted. Custom error bar heights are possible by passing an array-like object; in such cases err_bars must have the same dimensionality and shape as h.- linesbool
Whether to plot within-subject data as lines overlaid on the barplot.
- groupslist | None
List of lists containing the integers in
range(num_bars), with sub-lists indicating the desired grouping. For example, if h has has shape (10, 4) andaxis = -1then “num_bars” is 4; if you want the first bar isolated and the remaining three grouped, then specifygroups=[[0], [1, 2, 3]].- eq_group_widthsbool
Should all groups have the same width? If
False, all bars will have the same width. Ignored if groups isNone, since the bar/group distinction is meaningless in that case.- gap_sizefloat
Width of the gap between groups (if eq_group_width is
True) or between bars, expressed as a proportion [0,1) of group or bar width. Half the width of gap_size will be added between the outermost bars and the plot edges.- bracketslist of tuples | None
Location of significance brackets. Scheme is similar to the specification of groups; a bracket between the first and second bar and another between the third and fourth bars would be specified as
brackets=[(0, 1), (2, 3)]. Brackets between groups of bars instead of individual bars are specified as lists within the tuple:brackets=[([0, 1], [2, 3])]draws a single bracket between group[0, 1]and group[2, 3]. For best results, pairs of adjacent bars should come earlier in the list than non-adjacent pairs.- bracket_textstr | list | None
Text to display above brackets.
- bracket_inlinebool
If
True, bracket text will be vertically centered along a broken bracket line. IfFalse, text will be above the line.- bracket_group_linesbool
When drawing brackets between groups rather than single bars, should a horizontal line be drawn at each foot of the bracket to indicate this?
- bar_namesarray-like | None
Optional axis labels for each bar.
- group_namesarray-like | None
Optional axis labels for each group.
- bar_kwargsdict
Arguments passed to
matplotlib.pyplot.bar()(ex: color, linewidth).- err_kwargsdict
Arguments passed to
matplotlib.pyplot.bar(error_kw)(ex: ecolor, capsize).- line_kwargsdict
Arguments passed to
matplotlib.pyplot.plot()(e.g., color, marker, linestyle).- bracket_kwargsdict
arguments passed to
matplotlib.pyplot.plot()(e.g., color, marker, linestyle).- pval_kwargsdict
Arguments passed to
matplotlib.pyplot.annotate()when drawing bracket labels.- figure_kwargsdict
arguments passed to
matplotlib.pyplot.figure()(e.g., figsize, dpi, frameon).- smart_defaultsbool
Whether to use pyplot default colors (
False), or something more pleasing to the eye (True).- fnamestr | None
Path and name of output file. File type is inferred from the file extension of fname and should work for any of the types supported by pyplot (pdf, eps, svg, png, raw).
- axmatplotlib.pyplot.axes | None
A
matplotlib.pyplot.axesinstance. IfNone, a new figure with a single subplot will be created.
- Returns:
- phandle for the
matplotlib.pyplot.subplotinstance. - bhandle for the
matplotlib.pyplot.barinstance.
- phandle for the
Notes
- Known limitations:
- 1 Bracket heights don’t get properly set when generating multiple
subplots with
sharey=True(matplotlib seems to temporarily force theylimto +/- 0.6 in this case). Work around is to usesharey=Falseand manually setylimfor each subplot.- 2 Brackets that span groups cannot span partial groups. For example,
if
groups=[[0, 1, 2], [3, 4]]it is impossible to have a bracket at[(0, 1), (3, 4)]… it is only possible to do, e.g.,[0, (3, 4)](single bar vs group) or[(0, 1, 2), (3, 4)](full group vs full group).- 3 Bracket drawing is much better when adjacent pairs of bars are
specified before non-adjacent pairs of bars.
- Smart defaults sets the following parameters:
bar color: light gray (70%) error bar color: black line color: black bracket color: dark gray (30%)