Note
Go to the end to download the full example code.
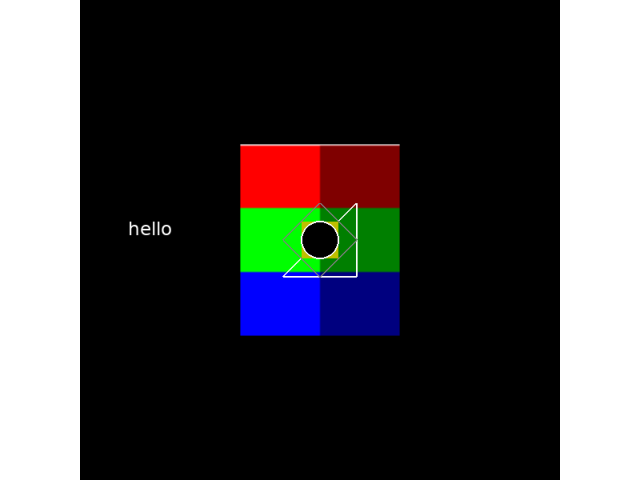
Experiment drawing methods#
expyfun provides multiple methods for drawing simple screen objects.
exp_name: test
date: 2026-07-13 21_19_21.731541
file: /home/circleci/project/examples/experiments/drawing_methods.py
participant: 2
session: 1
2026-07-13 21:19:21,731 - INFO    - Expyfun: Using version 2.0.0.dev0 (requested dev)
2026-07-13 21:19:21,794 - INFO    - Expyfun: Setting up sound card using pyglet backend with 2 playback channels
2026-07-13 21:19:21,854 - WARNING - Expyfun: Mismatch between reported stim sample rate (48000.0) and device sample rate (44100.0). Experiment Controller will resample for you, but this takes a non-trivial amount of processing time and may compromise your experimental timing and/or cause artifacts.
2026-07-13 21:19:21,854 - INFO    - Expyfun: Setting up screen
2026-07-13 21:19:21,895 - EXP     - Expyfun: Set screen visibility True
2026-07-13 21:19:21,898 - INFO    - Initialized [600 600] window on screen XlibScreenXrandr(display=<pyglet.display.xlib.XlibDisplay object at 0x7f6908b9e9b0>, x=0, y=0, width=1400, height=900) with DPI 69.73
2026-07-13 21:19:21,898 - INFO    - Expyfun: Initializing dummy triggering mode
2026-07-13 21:19:21,900 - INFO    - Expyfun: Initialization complete
2026-07-13 21:19:21,900 - EXP     - Expyfun: Participant: 2
2026-07-13 21:19:21,900 - EXP     - Expyfun: Session: 1
Skipping fill for <expyfun.visual._visual.Line object at 0x7f67a1cd9030>
2026-07-13 21:19:22,515 - INFO    - Expyfun: Exiting
2026-07-13 21:19:22,520 - EXP     - Expyfun: Audio stopped and reset.
# Author: Eric Larson <larsoner@uw.edu>
#
# License: BSD (3-clause)

import numpy as np

import expyfun.analyze as ea
from expyfun import ExperimentController, visual

print(__doc__)


with ExperimentController(
    "test",
    session="1",
    participant="2",
    full_screen=False,
    window_size=[600, 600],
    output_dir=None,
    version="dev",
) as ec:
    ec.screen_text("hello")

    # make an image with  alpha the x-dimension (columns), RGB upward
    img_buffer = np.zeros((120, 100, 4))
    img_buffer[:, :50, 3] = 1.0
    img_buffer[:, 50:, 3] = 0.5
    img_buffer[0] = 1
    for ii in range(3):
        img_buffer[ii * 40 : (ii + 1) * 40, :, ii] = 1.0
    img = visual.RawImage(ec, img_buffer, scale=2.0)

    # make a line, rectangle, diamond, and circle
    line = visual.Line(
        ec,
        [[-2, 2, 2, -2], [-2, 2, -2, -2]],
        units="deg",
        line_color="w",
        line_width=2.0,
    )
    rect = visual.Rectangle(ec, [0, 0, 2, 2], units="deg", fill_color="y")
    diamond = visual.Diamond(
        ec,
        [0, 0, 4, 4],
        units="deg",
        fill_color=None,
        line_color="gray",
        line_width=2.0,
    )
    circle = visual.Circle(
        ec, 1, units="deg", line_color="w", fill_color="k", line_width=2.0
    )

    # do the drawing, then flip
    for obj in [img, line, rect, diamond, circle]:
        obj.draw()

    screenshot = ec.screenshot()  # must be called *before* the flip
    ec.flip()
    ec.wait_for_presses(0.5)

ea.plot_screen(screenshot)
Total running time of the script: (0 minutes 0.836 seconds)