Note
Go to the end to download the full example code.
Generate vocoded stimuli#
This shows how to make simple vocoded stimuli.
@author: larsoner
2026-07-28 19:17:43,026 - INFO    - Read WAV file with 1 channel and 414951 samples (format int16)
/home/circleci/project/examples/stimuli/vocoded_stimuli.py:25: RuntimeWarning: invalid value encountered in divide
  data_noise = data_noise * 0.01 / rms(data_noise)
/home/circleci/project/examples/stimuli/vocoded_stimuli.py:28: RuntimeWarning: invalid value encountered in divide
  data_tone = data_tone * 0.01 / rms(data_tone)
/home/circleci/project/examples/stimuli/vocoded_stimuli.py:31: RuntimeWarning: invalid value encountered in divide
  data_click = data_click * 0.01 / rms(data_click)
/home/circleci/project/expyfun/_sound_controllers/_pyglet.py:107: RuntimeWarning: invalid value encountered in cast
  data = (data * (2**15)).astype("int16").tobytes()
import matplotlib.pyplot as plt
import numpy as np
from expyfun import fetch_data_file
from expyfun.stimuli import play_sound, read_wav, rms, vocode, window_edges
print(__doc__)
data, fs = read_wav(fetch_data_file("audio/dream.wav"))
data = window_edges(data[0], fs)
t = np.arange(data.size) / float(fs)
# noise vocoder
data_noise = vocode(data, fs, mode="noise")
data_noise = data_noise * 0.01 / rms(data_noise)
# sinewave vocoder
data_tone = vocode(data, fs, mode="tone")
data_tone = data_tone * 0.01 / rms(data_tone)
# poisson vocoder
data_click = vocode(data, fs, mode="poisson", rate=400)
data_click = data_click * 0.01 / rms(data_click)
# combine all three
cutoff = data.shape[-1] // 3
data_allthree = data_noise.copy()
data_allthree[cutoff : 2 * cutoff] = data_tone[cutoff : 2 * cutoff]
data_allthree[2 * cutoff :] = data_click[2 * cutoff :]
snd = play_sound(data_allthree, fs, norm=False, wait=False)
# Uncomment this to play the original, too:
# snd = play_sound(data, fs, norm=False, wait=False)
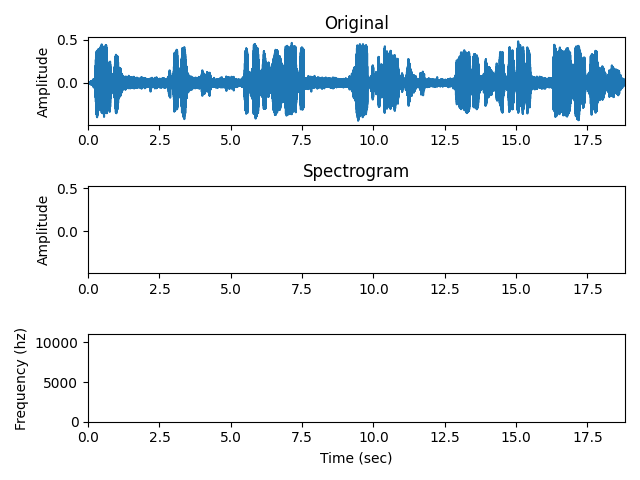
ax1 = plt.subplot(3, 1, 1)
ax1.plot(t, data)
ax1.set_title("Original")
ax1.set_ylabel("Amplitude")
ax2 = plt.subplot(3, 1, 2, sharex=ax1, sharey=ax1)
ax2.plot(t, data_noise)
ax2.set_title("Vocoded")
ax3 = plt.subplot(3, 1, 3, sharex=ax1)
ax2.set_title("Spectrogram")
ax2.set_ylabel("Amplitude")
ax3.specgram(data_noise, Fs=fs)
ax3.set_xlim(t[[0, -1]])
ax3.set_ylim([0, fs / 2.0])
ax3.set_ylabel("Frequency (hz)")
ax3.set_xlabel("Time (sec)")
plt.tight_layout()
plt.show()
Total running time of the script: (0 minutes 1.692 seconds)