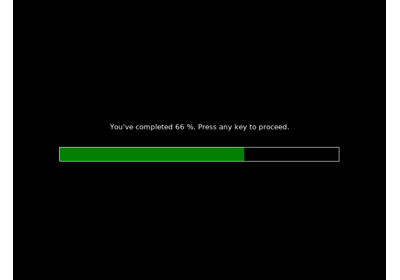
expyfun.visual.ProgressBar#
- class expyfun.visual.ProgressBar(ec, pos, units='norm', colors=('g', 'w'))[source]#
A progress bar that can be displayed between sections.
This uses two rectangles, one outline, and one solid to show how much progress has been made in the experiment.
- Parameters:
- ecinstance of ExperimentController
Parent EC.
- posarray-like
4-element array-like with X, Y center and width, height where x and y are coordinates of the box center.
- unitsstr
Units to use. These will apply to all spatial aspects of the drawing. Must be either
'norm'or'pix'.- colorslist or tuple of matplotlib Colors
Colors to fill and outline the bar respectively. Defaults to green and white.
Methods
draw()Draw the progress bar.
update_bar(percent)Update the progress of the bar.
