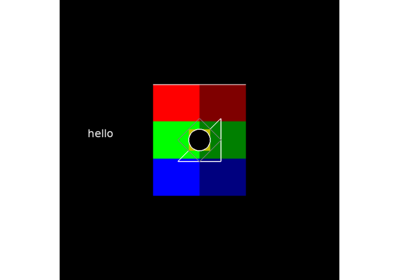
expyfun.visual.Line#
- class expyfun.visual.Line(ec, coords, units='norm', line_color='white', line_width=1.0, line_loop=False)[source]#
A connected set of line segments
- Parameters:
- ecinstance of ExperimentController
Parent EC.
- coordsarray-like
2 x N set of X, Y coordinates.
- unitsstr
Units to use. These will apply to all spatial aspects of the drawing. shape e.g. size, position. See
check_unitsfor options.- line_colormatplotlib Color
Color of the line.
- line_widthfloat
Line width in pixels.
- line_loopbool
If True, the last point will be joined to the first in a loop.
Methods
draw()Draw the object to the display buffer.
set_coords(coords[, units])Set line coordinates
set_fill_color(fill_color)Set the object color
set_line_color(line_color)Set the object color
set_line_width(line_width)Set the line width in pixels
- Returns:
- lineinstance of Line
The line object.
- set_coords(coords, units='norm')[source]#
Set line coordinates
- Parameters:
- coordsarray-like
2 x N set of X, Y coordinates.
- unitsstr
Units to use.
- set_fill_color(fill_color)[source]#
Set the object color
- Parameters:
- fill_colormatplotlib Color | None
The fill color. Use None for no fill.
